Visualizing Fields
1D Field Using matplotlib or gnuplot
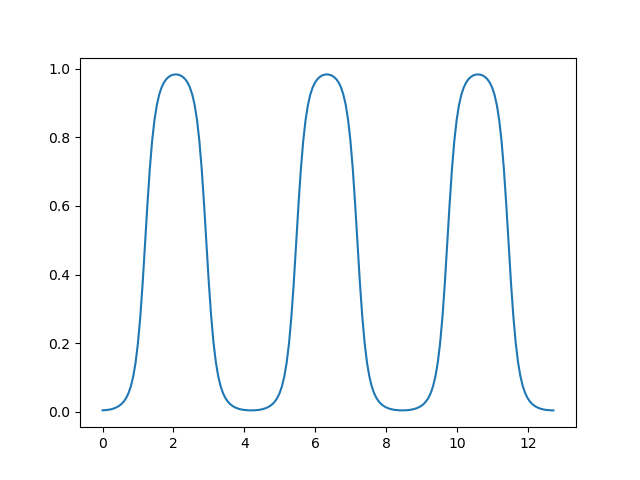
- matplotlib example::
import matplotlib.pyplot as plt
filename = “density_1D.dat” fields = fk.read_from_file(filename) newfields = fk.replicate_fields(fields, 3)
#very basic plotting plt.figure plt.plot(newfields[0].coords, newfields[0].data) plt.show()
gnuplot example
On Terminal (Linux): gnuplot
p './density_1D.dat' u 1:2
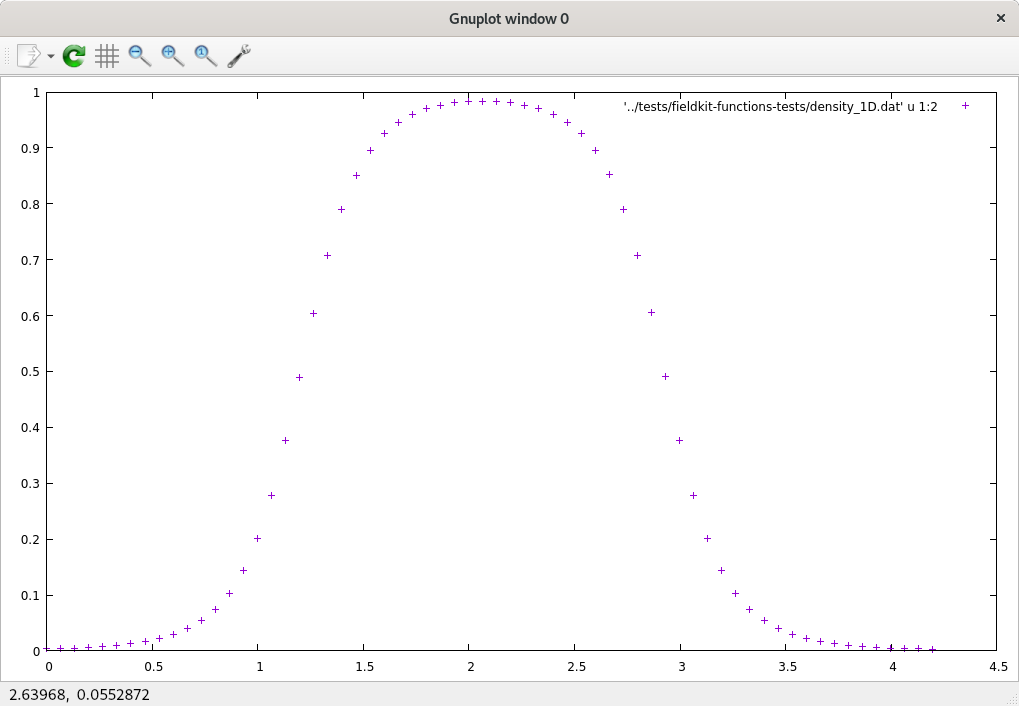
Note: 1:2 means plotting column 1 and column 2
2D/3D Fields Using Paraview
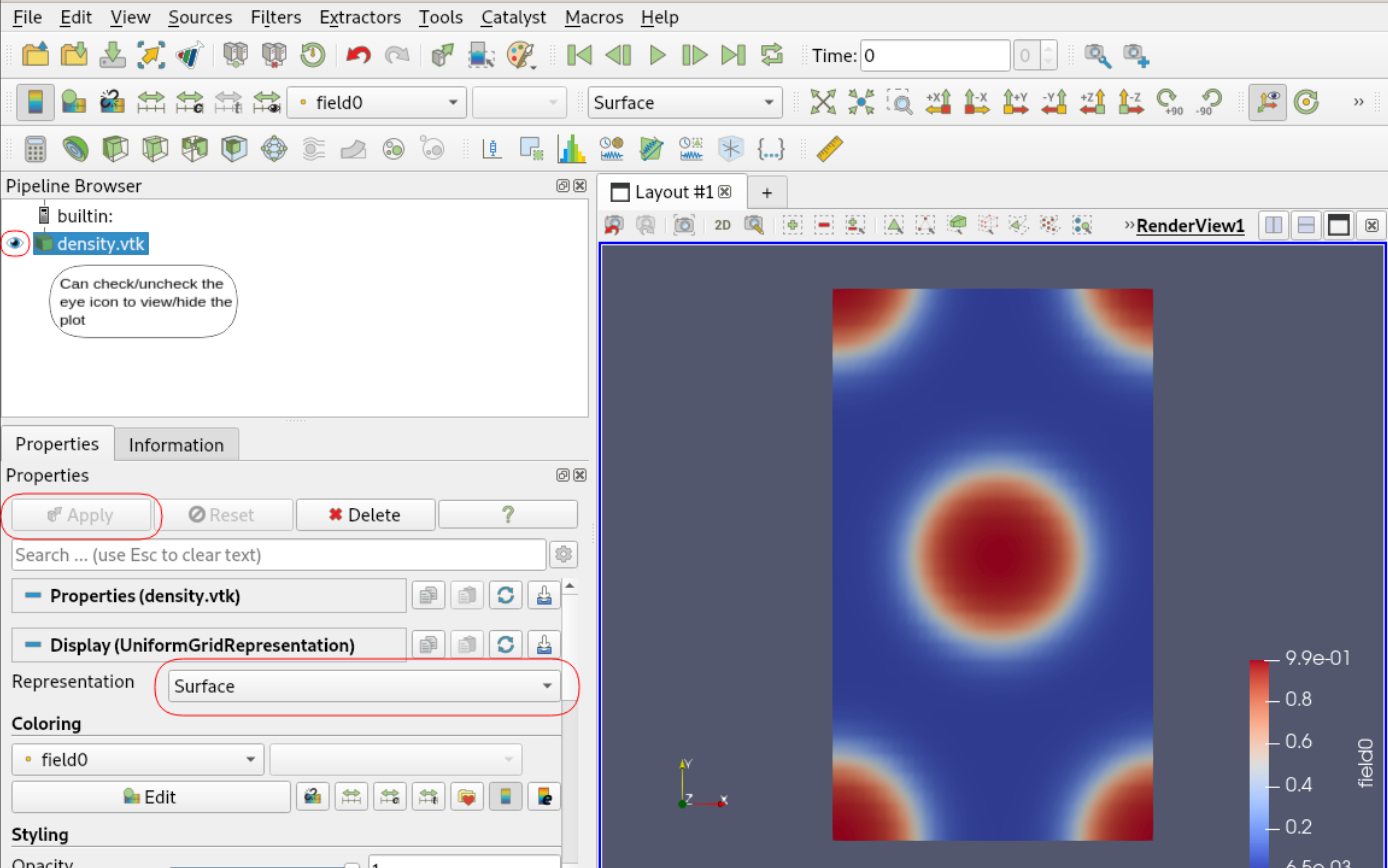
For 2D plots
Using density.vtk as an example. First, change the current directory to the same directory density.vtk is in.
On Terminal: paraview density.vtk
On Paraview: Click “Apply” and change Representation to “Surface”
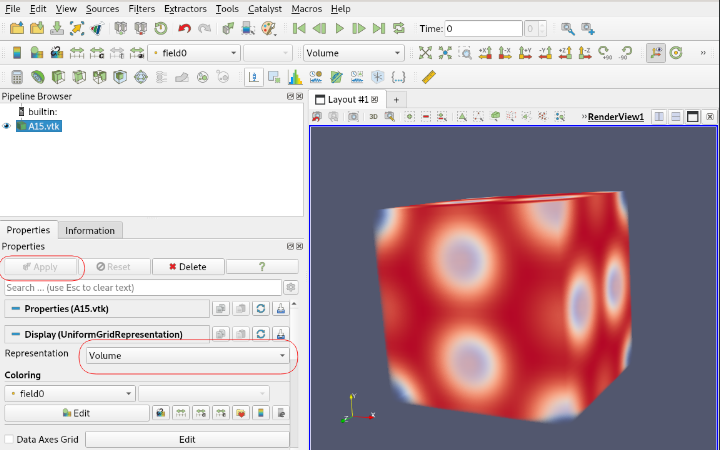
For 3D plots
Using A15.vtk as an example. First, change the current directory to the same directory A15.vtk is in.
On Terminal: paraview A15.vtk
On Paraview: Click “Apply” and change Representation to “Volume”